In previous article(Click Here to know about creating autonomous database cloud services in OCI), we seen how to create an Oracle Autonomous Transaction Processing Database service in Oracle Cloud Infrastructure Services. Since it is the autonomous database service so user or Database Administrators are not entitled to have access to the compute nodes where these autonomous database services are running. Oracle does things automatically itself.
Still you can monitor the autonomous database workloads using its monitoring service console and you can monitor the currently running SQL statements, CPU utilization, Storage usage etc. on its underline machine where your autonomous database cloud service is hosted.
Login to the autonomous database directly using its service console link or you can do that via navigating through your Oracle Cloud Infrastructure Console (to know about navigating through Oracle Cloud Infrastructure Console - Click here)
I have the direct link for its service console for my autonomous database cloud service so I login there as below.
Click on "Sign in" and you get the Autonomous Transaction Processing - Overview page.
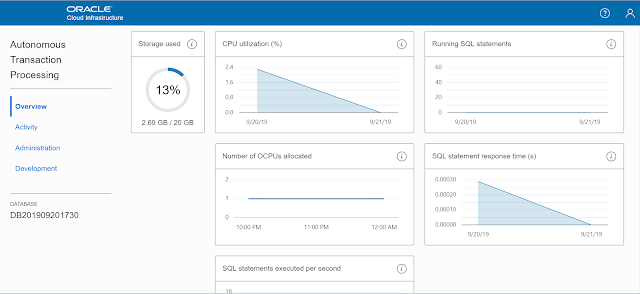
On Overview page - you can see the Storage used by the current ATP instance, you get average CPU utilization over a period of time, average number of SQL statements running over a period of time. No. of OCPU allocated for this autonomous database instance, average response time for the SQL statements etc. This page gives an idea about overall workload and average response time of the SQL statements for this database service.
Click on on "Activity" option under "Autonomous Transaction Processing" and you get SQL Monitoring details - there are two separate tabs on this page one is "Monitor" and the other is "Monitored SQL".
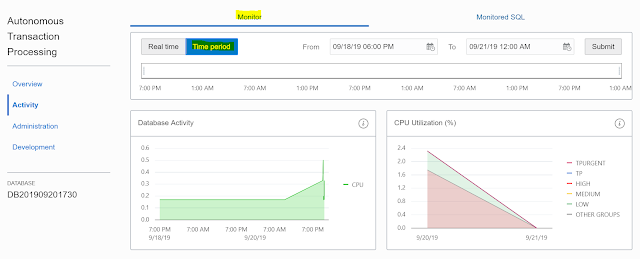
Under "Monitor" tab (is default tab for Activity option), you get "Real time" database workload i.e. "Database Activity", "CPU Utilization", "Running Statements", "Queued Statements", it is very similar to the Oracle Enterprise Manager's Performance Hub where we get similar way to look over the real time database activities.
Second tab - "Time period" under the "Monitor" is to look for the historical monitoring data that gets captured in previous "Real time" tab. You can select "From" and "To" time-periods and Submit the search criteria to get Database activity, CPU utilization etc details historically.
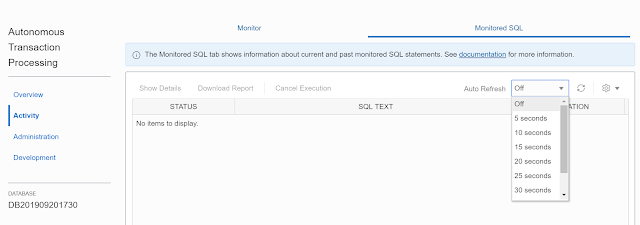
On the Activity page, click on the second tab - "Monitored SQL" this tab shows current and past SQL statements and you get the more commands on the SQL statements running in the database.
To see the detailed SQL Monitor report for a statement, select a statement and click Show Details. The Overview tab in the pop-up shows general information for that statement. Click Plan Statistics tab to see the run-time execution plan of the statement. Click Parallel tab to see information about the parallel processes, if the statement uses parallelism.
If you want to download an active SQL Monitor report for a statement, select the statement in the Monitored SQL page and click Download report. This will save the active SQL Monitor report to your client
To cancel a running statement, select that statement in the Monitored SQL list and click Cancel execution. Tt is very much like "ALTER SYSTEM CANCEL SQL" command introduced in Oracle Database 12c Release 2 (to know more about cancelling a particular SQL statement running in a database session - Click Here).
You can add more monitoring attributes on this page by clicking on the "Setting" drop down menu at right side of the "Auto Refresh" option. You can "Check"/"Un-check" the fields you want to be displayed from the setting drop-down list
Now, click on the "Administration" option in left panel to perform some administration work. You can download the client credentials (Wallet) from here that includes the TNS details of the autonomous transaction processing instance that you can use to connect from your local client machine - i.e. SQL*Plus client, SQL Developer.
You can define Resource Management rules for the CPU and I/O for consumer groups to cancel SQL statements automatically when it crosses the defined CPU/IO thresholds.
Using the "Set Administrator Password", you can create or reset the password for the autonomous database administrator's password, default administrator is ADMIN user. You can also unlock the ADMIN administrator account if it is locked.
You can create/modify Oracle Machine Learning Users using the "Manage Oracle ML Users" option.
Click on the "Development" in left panel to deal with development related tool and applications. From here, you can jump to "Oracle APEX", "SQL Developer Web" (Click Here to know how to use this "SQL Developer Web" application to connect to your Autonomous Database Transaction Processing Instance)
You can use Oracle's newly introduced Machine Learning Notebook, download Oracle Instant Client etc.
Hope it helps, thanks for reading, please subscribe to this blog to stay updated with latest news on Oracle Autonomous Database Cloud Services and new articles.
Twitter : https://twitter.com/rajsoft8899
Linkedin : https://www.linkedin.com/in/raj-kumar-kushwaha-5a289219/


I have read a few of the articles on your website now, and I really like your style of blogging. I added it to my favorites blog site list and will be checking back soon. Please check out my site as well and let me know what you think. json formatter
ReplyDelete
ReplyDeleteThis concept is a good way to enhance the knowledge.thanks for sharing.. Great article ...Thanks for your great information, the contents are quiet interesting.
SQL Azure Online Training
Azure SQL Training
SQL Azure Training
Great post.
ReplyDeletehttp://www.icoph.org/connections/user_profile/0030H00005LopyBQAR/Abdul-Bari-Mishaal.html